
Your shopping cart is empty!
Different Principles: Implementing MIR Spectrometers
This article mainly describes the principles of scanning imaging using a grating spectrometer.
Introduction:
Mid- and far-infrared spectrometers play an important role in scientific research, environmental monitoring, and materials analysis. Different principles and techniques enable these instruments to detect and analyze the spectral characteristics of substances in diverse ways. Whether it is spectroscopy technology based on Fourier transform or the traditional method of light splitting through gratings, each principle has its unique advantages and application scenarios. Below Optosky will discuss the main principles of mid- and far-infrared spectrometers.
1.Fourier Transform Infrared (FTIR)
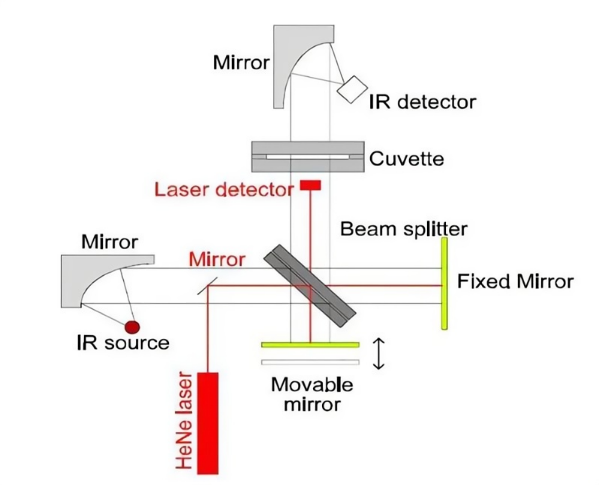
Fourier Transform Infrared (FTIR) spectrometer is mainly composed of infrared light source, beam splitter, interferometer, sample cell, detector, computer data processing system, recording system, etc. It is a typical representative of interference infrared spectrometer. Different from the working principle of the dispersive infrared instrument, it does not have a monochromator and a slit. It uses a Michelson interferometer to obtain the interference pattern of the incident light, and then uses Fourier mathematical transformation to transform the time domain function interference pattern into a frequency domain function. Figure (ordinary infrared spectrum).
2.Acousto-Optic Filter Type (AOTF)
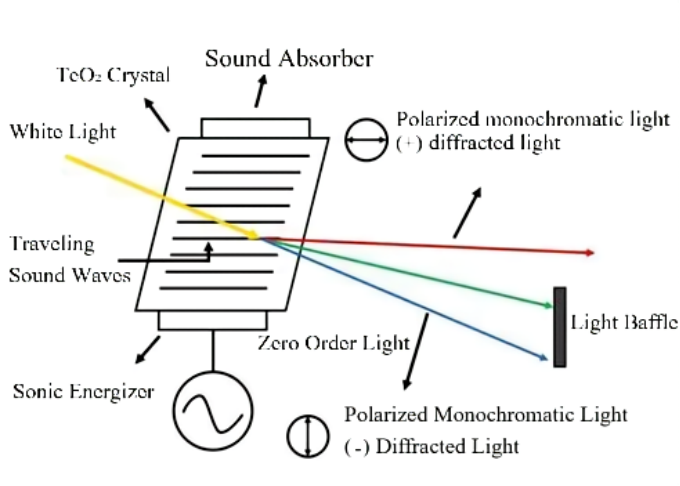
The acousto-optic filter infrared spectrometer is a spectroscopic device based on the principle of acousto-optic diffraction and made of birefringent single crystal with high acousto-optic quality factor and low acoustic attenuation. AOTF is composed of birefringent crystal, radio frequency radiation source, electroacoustic converter and acoustic wave absorber.
3.NLIR technology
The core of NLIR technology is to provide a high-intensity laser field (1064nm, >1MW/cm2 continuous wave) inside the crystal in a simple way, allowing mid- and far-infrared light to enter, and the generated near-visible light can leave without being attenuated. The figure below illustrates a crystal with penetration of a high-power laser field (green) and the mid- and far-infrared light signals (red) overlapping with the high-power field. The converted beam (blue) at the output can be separated from the high-power beam and used near Measurements are made with visible light detectors, such as silicon-based CMOS arrays, APDs or even smartphone cameras.
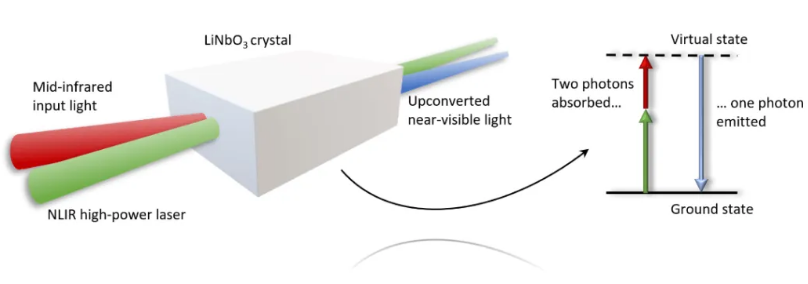
The schematic shown by the arrow illustrates the conservation of energy during upconversion. In this process, a photon from a high-power laser field and a photon of mid- to far-infrared light combine to become a photon of near-visible light; the length of the arrow represents the energy and therefore the wavelength. The term "virtual state" at the top of the diagram refers to a physical state in which the photon is not absorbed into the crystal (as is the case with electron absorption), but simply interacts with the bound electron via an electric force. After conversion, near visible light can be detected using a detector suitable for the application. This can be achieved with CMOS arrays in grating spectrometers (such as 2.0 – 5.0 μm spectrometers) or very fast or sensitive point detectors (such as single-wavelength detectors).
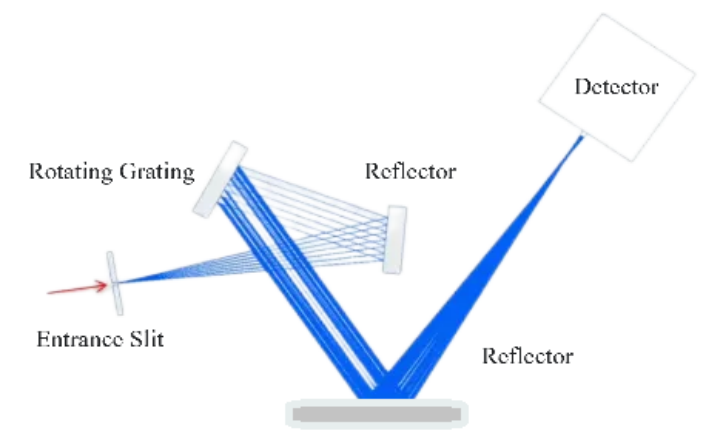
4.Scan grating
The signal light enters the optical platform of the grating spectrometer through an SMA fiber interface. The signal light first passes through the fixed incident slit and reaches the reflector. After being reflected by the reflector, it reaches the rotating grating. The rotating grating rotates at a constant speed on the turntable. Therefore, There is a one-to-one correspondence between the grating splitting angle and the wavelength. Finally, the signal light reaches the detector through the reflector, and the optical signal is converted into an electrical signal, which is recorded by the computer.
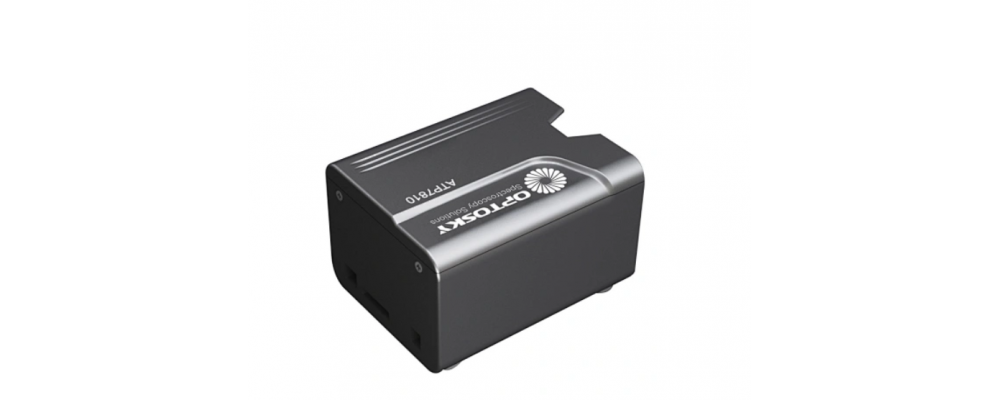
The ATP7810 grating spectrometer series produced by Optosky uses the principle of scanning grating. The ATP7810 system utilizes a simulation-optimized optical system to ensure high resolution. There are multiple input and output options, providing researchers with endless possibilities, scalability and diversity. Either single point detectors or various array cameras can be used. ATP7810 has a variety of models with different waveband ranges: 0.8~2.5μm, 1.0~6.0μm, 1.0~9.0μm, 1.0~12.0μm, 1.0~25.0μm, which can cover the range from near infrared to mid-far infrared, just choose the right one The grating can have more freedom in the selection of wavelength and resolution.
-100x100.png)


Search
Categories
Popular Posts


Latest Posts


Comments: 0
No comments